
Consumer price index
A statistical estimate of consumer price levels over time.

Wikideas1 · CC0
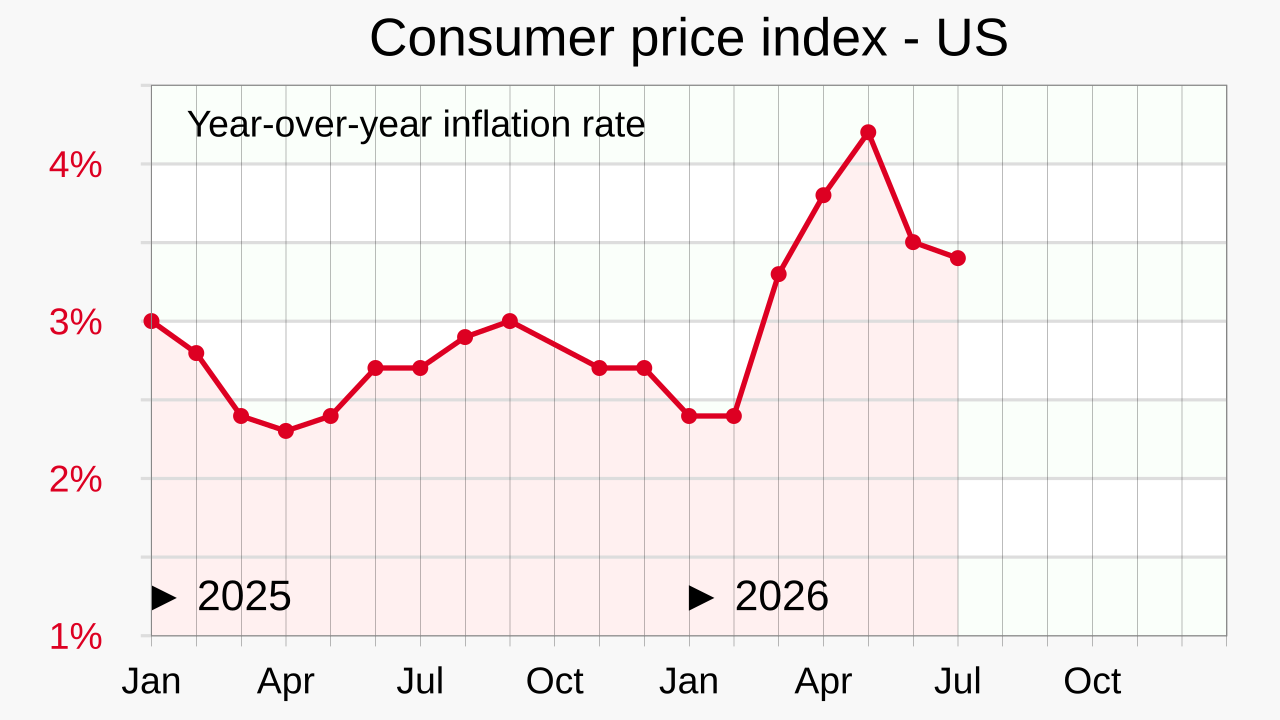
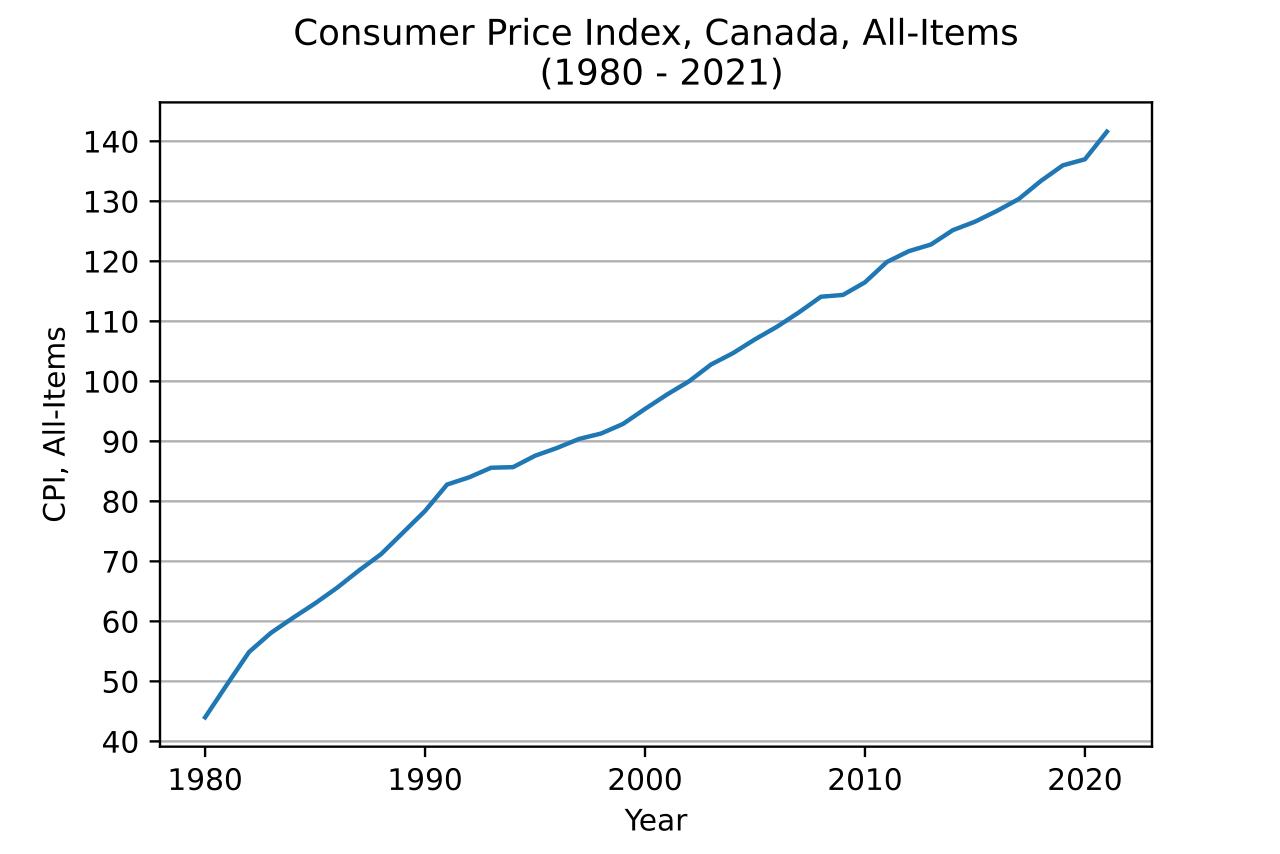
A consumer price index (CPI) is a statistical estimate of the level of prices of goods and services bought for consumption purposes by households. It is calculated as the weighted average price of a market basket of consumer goods and services, with changes in CPI tracking changes in prices over time. The CPI is one of the most closely watched national economic statistics in most countries, used to measure inflation, index wages and pensions, and deflate monetary magnitudes.
- field
- Economics
- known_for
- Measuring inflation via a weighted average of consumer goods and services prices
- first_proposed_by
- Joseph Lowe (1822)
- typical_calculation_frequency
- Monthly or quarterly
- common_reporting_agencies
- National statistical agencies, Bureau of Labor Statistics (US), OECD
Lore & Background
The concept of a price basket index was first proposed by English economist Joseph Lowe in 1822. His fixed basket approach computed the price of a list of goods in one period and compared it to the price of the same basket in another period. Later economists built on his elementary ideas to form the modern definition of the CPI.
The CPI is constructed using prices collected periodically from a sample of retail and service establishments. Sub-indices for categories like food, housing, and clothing are weighted by their shares in consumer expenditures and combined into the overall index. The weights are typically based on estimated expenditures during the preceding whole year, making the index a fixed-weight index that rarely coincides with a true Laspeyres index.
In some countries, such as the United States and Sweden, the CPI is inspired by and approximates a true cost-of-living index that would show how consumer expenditure must move to maintain a constant standard of living. In most of Europe, the index is regarded more pragmatically. The index reference period (base year) often differs from both the weight-reference period and the price-reference period.
Reader's Guide
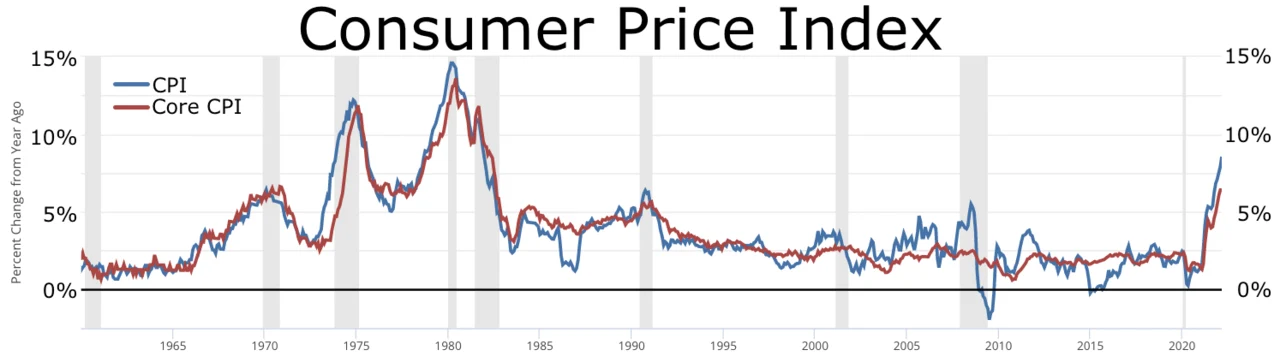
The consumer price index is a fundamental economic indicator used to track inflation over time and compare inflation rates between different countries. While not a perfect measure of inflation or the cost of living, it is a useful tool for these purposes. The annual percentage change in the CPI is used as a measure of inflation, and the index is used to index the real value of wages, salaries, and pensions; to regulate prices; and to deflate monetary magnitudes to show changes in real values.
The calculation involves collecting prices of a representative sample of items—for example, 85,000 items from 22,000 stores and 35,000 rental units in one instance—and weighting them by categories such as housing (41.4%), food and beverages (17.4%), transport (17.0%), medical care (6.9%), apparel (6.0%), entertainment (4.4%), and other (6.9%). Taxes are not included in CPI computation. The index is usually computed monthly or quarterly, and international organizations like the OECD report CPI figures for many member countries. Annually revised weights are desirable but expensive; older weights increase divergence between current expenditure patterns and the weight reference period.
Did You Know?
- The CPI was first proposed by English economist Joseph Lowe in 1822 using a fixed basket approach.
- The CPI is calculated as the weighted average price of a market basket of consumer goods and services.
- In the United States, the CPI is usually reported by the Bureau of Labor Statistics.
- Taxes are not included in CPI computation.
A Family of Indices Serving Different Purposes
The CPI is not a single number but a collection of price indices released monthly by the Bureau of Labor Statistics. The two most widely referenced are the CPI-U and the CPI-W. The CPI-U is the go-to gauge for consumer inflation in the United States, while the CPI-W specifically anchors the indexing of Social Security benefit payments. Beyond these two, numerous alternative versions exist tailored to particular analytical needs. Importantly, the CPI is not the sole price measure in the U.S. statistical toolkit. A closely related but distinct index, the Personal Consumption Expenditures (PCE) price index, captures a broader universe of goods and services and differs in other methodological respects. This layered structure means that depending on the policy question at hand—whether it is tracking everyday inflation for the general public or calibrating federal benefit payments—different indices within the CPI family, or the PCE itself, may be the appropriate reference point for a given analysis.
Drawing the Line: What the CPI Includes and Excludes
The CPI tracks the monthly price movement of a basket of discretionary consumption goods across eight major categories: food and beverages, housing, apparel, transportation, medical care, recreation, education and communication, and other goods and services. Crucially, the index draws a firm boundary between consumption and investment. Life insurance, securities, financing costs, and outright house prices are all excluded because they represent investment rather than consumption. Income and property taxes, employer-provided benefits, and healthcare costs covered by insurance or government programs like Medicare are also left out, since consumers do not directly bear those prices. On the other side of the line, sales and excise taxes, out-of-pocket medical expenses, and consumer-paid health insurance premiums including Medicare Part B are included. Illegal goods such as marijuana fall outside the scope entirely. For items like pleasure boats or aircraft that technically belong in the basket but are too impractical to price individually, the BLS imputes the price change from a broader relevant category while still capturing the item's true weight through the Consumer Expenditure Survey.
Sampling the Nation: Geography and Stratification
The CPI-U is designed to reflect the experience of a representative metropolitan household, covering roughly 93 percent of the U.S. population. Rural, farm, military, and institutionalized households fall outside its scope. To make measurement feasible, the BLS works with Primary Sampling Units drawn from core-based statistical areas, pricing only 75 of them each month. Twenty-three are self-representing, meaning their measured price changes apply solely to themselves. Twenty-one are major metros with populations above 2.5 million, while Anchorage and Honolulu stand in for all of Alaska and Hawaii. Together these self-representing PSUs account for 42 percent of the target population. The remaining 52 PSUs are metropolitan or micropolitan areas whose price changes are imputed from a deemed-equivalent sampled PSU. Grouping PSUs into equivalence classes, called stratification, uses a variant of k-means clustering on four variables: latitude, longitude, median property value, and median household income. Within each stratum, the specific PSU selected for pricing is chosen at random. This two-tier design ensures that both sprawling metros like Houston and small micropolitan areas like Paris, Texas, are represented in the final index.
Collecting and Adjusting: The Mechanics of Monthly Pricing
Every month, BLS data collectors gather approximately 94,000 individual price quotes. For most items, this means contacting the retail outlet where a consumer would make the purchase. Two-thirds of quotes are obtained through in-person visits, with the rest collected by telephone or via the store's website. As of 2017, about 8 percent of quotes came from online retailers, a share roughly matching the fraction of consumer retail spending flowing through e-commerce. Certain items, such as airfares, are priced through industry-specific data sources rather than direct store visits. Most prices are recorded per unit, though commodities like gasoline or certain food items are measured by unit weight. A critical refinement is quality adjustment, or hedonic regression. When a product's features shift between measurement periods—a smartphone gaining an extra camera or more storage—the raw price gap would misleadingly suggest pure inflation. Hedonic adjustment strips out the value attributable to those feature changes, isolating the true price movement of a constant-quality item. If the old product no longer exists, a price is imputed for a new product by estimating what it would have cost with the old product's characteristics. Each quality-adjusted category carries its own set of priced characteristics and a model for the marginal value of each one.
Gallery
Frequently Asked Questions
Who is Consumer Price Index?
The CPI is a statistical gauge that tracks the average cost of goods and services households actually buy. The idea was first put forward by Joseph Lowe in 1822, and today it is maintained by national statistical offices around the world.
What are Consumer Price Index's powers/role?
Its core function is to measure inflation by comparing the weighted average price of a fixed basket of consumer items from one period to the next. It also serves as the reference point for adjusting wages, pensions, and for converting nominal dollar figures into real terms.
How does Consumer Price Index's story end?
It has no true ending because the series is recalculated and published on a rolling monthly or quarterly basis by the responsible agency. As long as households continue purchasing goods and services, the index keeps getting updated.
Why is Consumer Price Index important?
It is one of the most closely monitored economic indicators in most countries because it directly shapes how people understand whether their purchasing power is rising or falling. Governments, workers, and investors all lean on it when setting monetary policy, negotiating contracts, or planning budgets.
Who reports Consumer Price Index and how often?
In the United States the Bureau of Labor Statistics produces the figure, while other nations rely on their own statistical agencies or international bodies such as the OECD. Releases typically come out on a monthly or quarterly cycle depending on the country's reporting schedule.
More in Economic Concepts & Models 1-24
Elsewhere in the Economic Concepts & Models universe
Spotted an error? Know more?
This is a living reference — every entry is fact-audited, and reader corrections feed straight into our audit queue. Suggest an edit · See this site's audit record